Table of Contents
- Getting Started
- EO.Pdf
- EO.Web
- EO.WebBrowser
- EO.Wpf
- Common Topics
- Reference EO.Total Dlls
- Adding EO controls to Visual Studio Toolbox
- Deployment
- Collecting Runtime Logs
- Collecting Crash Report
- Using DebugTools
- Using eowp.exe
- Troubleshooting Child Process Error
- Using EO.WebEngine JavaScript Interface
- Using with .NET Core (including .NET 5 and newer)
- Choosing between x86 build and x64 build
- Reference
| Using DebugTools |
DebugTools is a GUI application to perform various debug related tasks such as capturing internal debug information or logs. To start DebugTools, go to the installation folder and double click DebugTools.exe, or launch the application from the shortcut in your Windows Start Menu. To avoid compatibility issues, you should always run DebugTools.exe that comes from the same build used by your application.
Use Remote Debug Monitor
Remote Debug Monitor allows Essential Objects developers to remotely examine internal running state/data of your application. While the communication between the Remote Debug Monitor and Essential Objects is encrypted, running Remote Debug Monitor does have a negative impact on the application's performance. Furthermore, Essential Objects only actively investigate a remote session that is pre-scheduled with our users. So you should only run Remote Debug Monitor after you have contacted Essential Objects and was recommended and scheduled to run this tool.
Follow these steps to run Remote Debug Monitor:
- Contact Essential Objects first to see if remote debug can be helpful for your case and schedule such session before hand;
- Start DebugTools;
- Select Tools -> Start Remote Debug Monitor from the main menu;
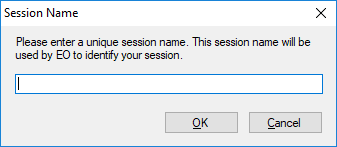
-
Enter your session name (used by EO to identify your session) and click "OK";
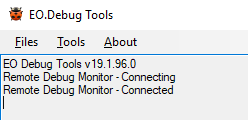
-
Wait for the message to indicate that the Remote Debug Monitor is connected;
- Contact Essential Objects again so that we can examine the state of your application.
- Select Tools -> Stop Remote Debug Monitor from the main menu to stop the remote debug monitor when done;
Capture Debug Information
Some issues are hard to reproduce and may only occur at certain time and circumstance. In such case it may be useful to capture the debug information and send this information to Essential Objects for analysis. Follow these steps to capture and submit debug information:
- Update to the latest build if possible. We must match debug information with our internal debug symbols to analyze them. Due to the enormous size of the debug symbols, we only keep debug symbols for recent builds. As such debug information from older builds will have little use;
- Run your application and wait for the problem to occur;
- Start DebugTools;
- Select Tools -> Capture Debug Information from the main menu;
- When prompted, enter a file name to which the debug data will be saved;
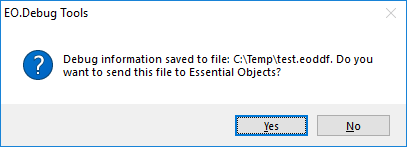
-
Select "Yes" when asked whether you wish to submit this data to Essential Objects;
- Contact Us dialog appears with the debug data file already attached. You can fill in other fields, attach additional files and then click "Send" to send the message to Essential Objects;
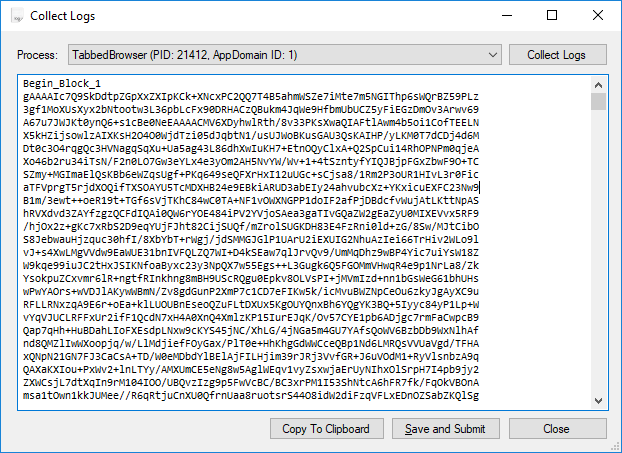
Collect Log Data
Use this tool to collect internal running logs for a specific application (when you may have multiple applications using EO products running). Follow these steps to use this tool:
- Start DebugTools;
- Select Tools -> Collect Logs from the main menu;
-
Select the target process, then click "Collect Logs";
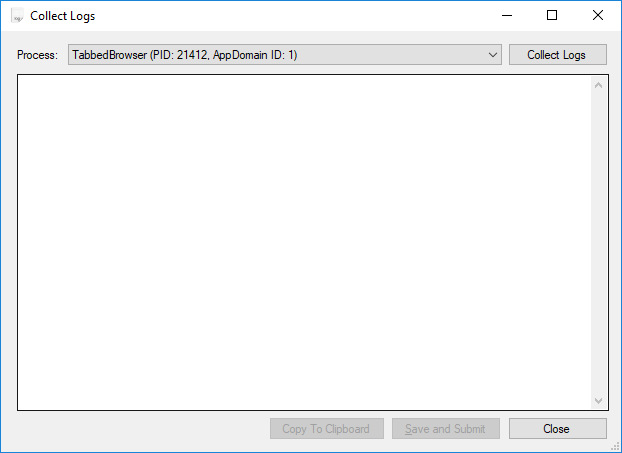
-
After the encoded log data appears in the textbox below, you can click
"Copy to Clipboard" to copy the log data to clipboard, or use "Save and Submit"
to save it to a file and submit the file to Essential Objects directly;
Run Built-in Tests
Use this tool to run various internal tests and collect the test result. Please contact Essential Objects first on which test to run.
- Start DebugTools;
- Select Tools -> Run Tests -> Built-in Test from the main menu;
-
Select the tests that Essential Objects support told you to run;
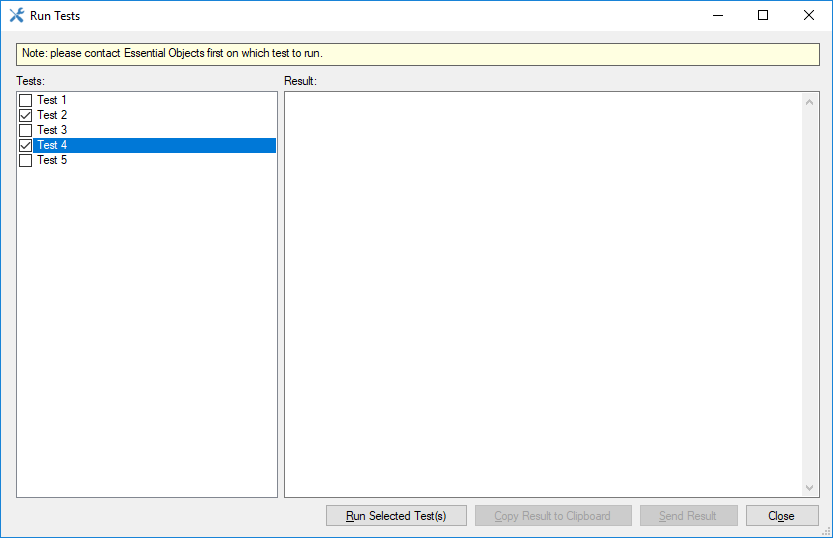
- After the encoded test result appears in the textbox below, you can click "Copy to Clipboard" to copy the log data to clipboard, or use "Send Result" to send the result to Essential Objects directly;
Run Custom Tests
Use this tool to run custom tests and collect the test result. A custom test is a test EO support specifically created to troubleshoot an issue that maybe hard to reproduce elsewhere. Follow these steps to run a custom test:
- Start DebugTools;
- Select Tools -> Run Tests -> Custom Test from the main menu;
- Enter the test number provided by EO support;
- Click "Start" to start the test;
-
If everything works correctly, you should see the following messages in the output window:
Downloading test files....
Extracting test files....
Running the test....
Submitting result....
Result submitted successfully. You may close this window now.
- Once the test result has been submitted, EO support will be notified and start to analyze the result.
Contact Essential Objects
You can use DebugTools to contact Essential Objects directly:
- Start DebugTools;
- Select Tools -> Contact Us from the main menu;
-
The "Contact Us" dialog appears;
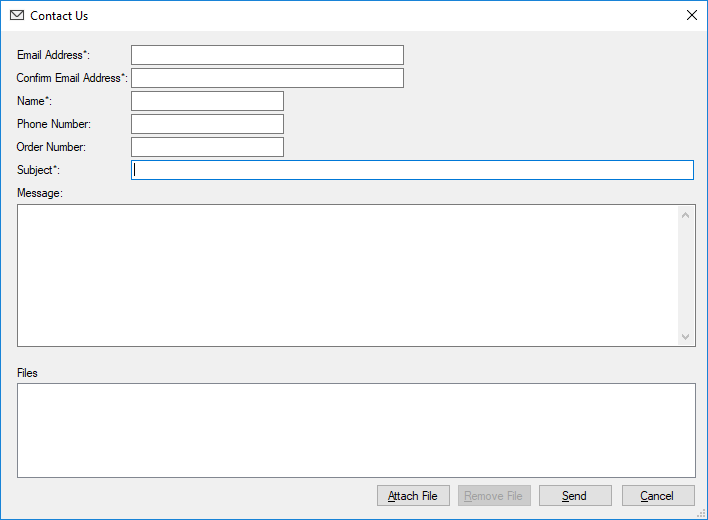
-
Fill in the required fields and enter your message.
Note: you must enter a valid email address in order to submit the message successfully because the message must be confirmed through this email address (see step 7);
- Optionally, use "Attach File" to attach one or more files;
- Click "Send" to send the message to Essential Objects;
- Wait for the verification email at the email address provided in step 4;
- Click the verification link in the email to confirm the message;