Table of Contents
- Getting Started
- EO.Pdf
- EO.Web
- EO.WebBrowser
- Overview
- Installation and Deployment
- Getting Started
- Customizing WebView
- Advanced Topics
- Executing JavaScript Code
- JavaScript and DOM Interface
- Using JavaScript Extension
- Passing Complex Data Objects in between JavaScript and .NET
- Custom Resource Handler
- Custom Response Handling
- Handling Input Events
- Handling New Window
- Managing Browser Engines
- Setting WebView Options
- Authentication
- Working with Certificates
- Working with Local Files
- Printing Pages
- HTML 5 Support
- Using Plugins
- Debugging Web Pages
- Using Google Services
- EO.Wpf
- Common Topics
- Reference
| Debugging Web Pages |
EO.WebBrowser includes Chromium's built-in developer tool interface. You can invoke the developer tool UI either through EO.WebBrowser's built-in debug UI or using the remote debugging feature.
Through EO.WebBrowser's Built-In Debug UI
The following steps outlines how to access EO.WebBrowser's debug UI.
- Call EO.WebBrowser.WebView.ShowDebugUI in your code.
-
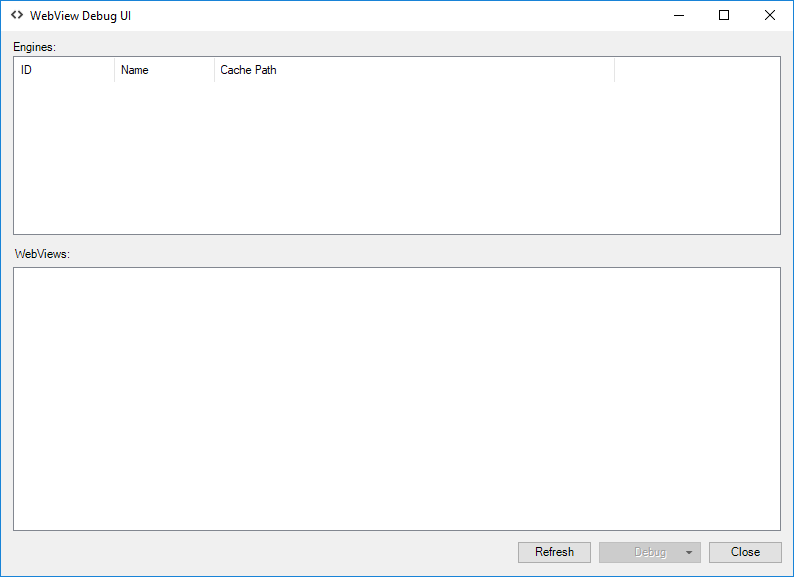
Run the above code, the following Debug UI is displayed. Notice both lists are empty:
-
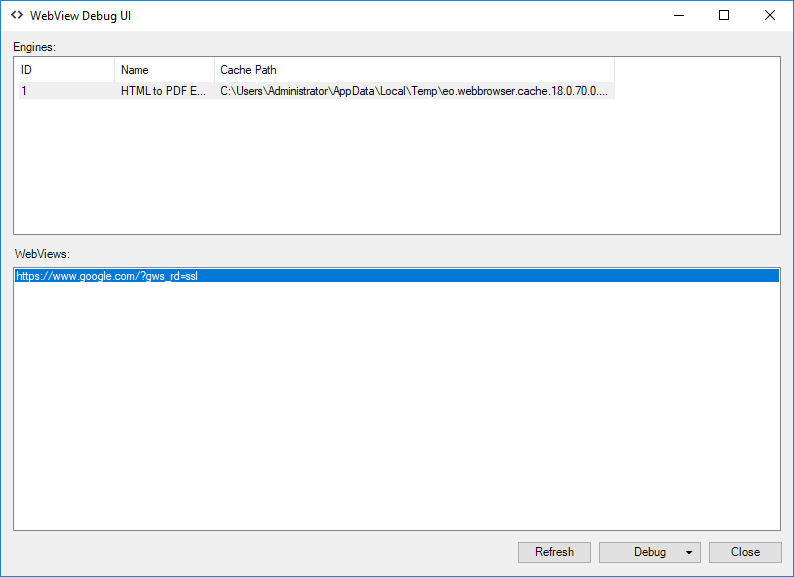
Click the "Refresh" button. This should populate the "Engine" list.
Select an Engine and it should display the list of Urls that are currently loaded through
this Engine in the "WebView" list. Select the Url you wish to debug
(in this example Google's Url):
-
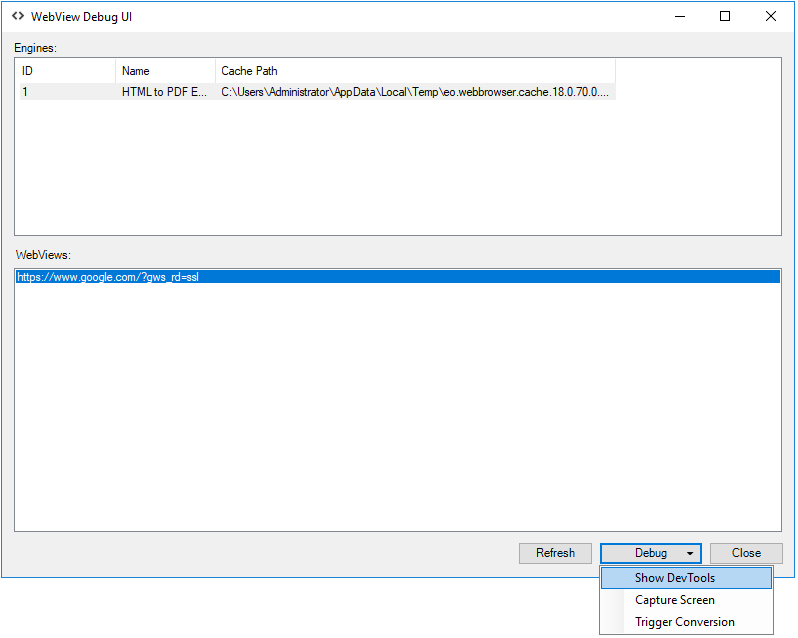
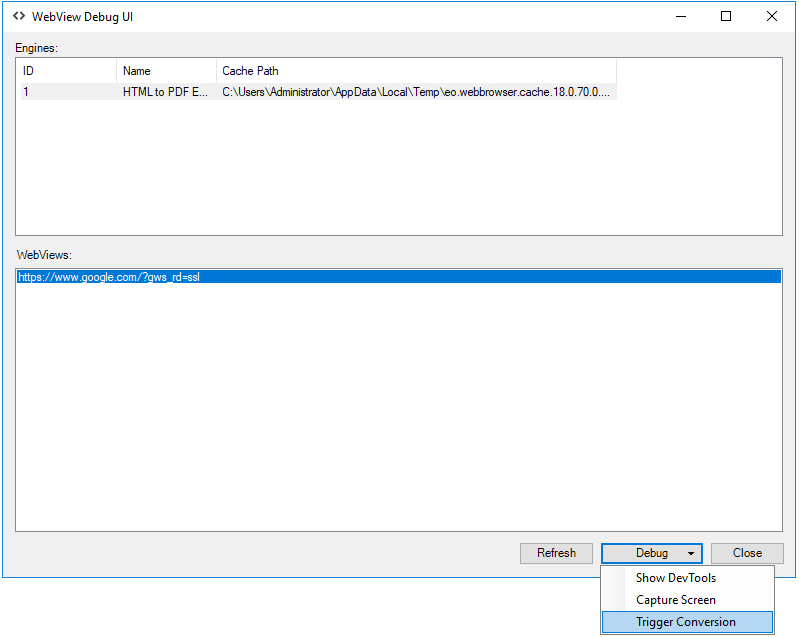
Click "Debug" button to open the drop down menu, then select "Show DevTools":
-
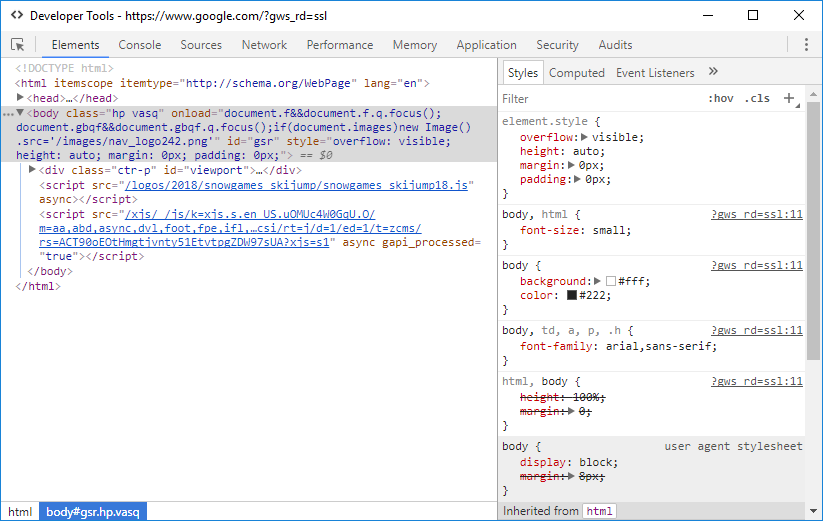
This will display Chromium's built-in Developer Tools UI that you can use to debug
the page:
-
If you are debugging a page loaded by the HTML to PDF converter, you can select "Trigger Conversion" from the
debug drop down menu to trigger the conversion:
Using Remote Debugging Feature
EO.WebBrowser supports Chromium's remote debugging protocol. Follow these steps to debug a page loaded by EO.WebBrowser remotely:
-
Set EO.WebEngine.EngineOptions.Default.RemoteDebugPort to a port number that is free on your system. For example, 1234.
//Enable remote debugging on port 1234 EO.WebEngine.EngineOptions.Default.RemoteDebugPort = 1234; -
Load the page you wish to debug with EO.WebBrowser.WebView. The following image shows using the TabbedBrowser demo application to load Google's home page after setting RemoteDebugPort to 1234. There is no visible difference whether remote debugging is enabled or not;
-
Start another instance of the TabbedBrowser sample application, then enter address "http://localhost:port_number" in the address bar. Here "port_number" is the port number used in the previous step;
Note: It's important that you use the TabbedBrowser sample application instead of the regular Google Chrome browser as the remote debug client. Even though both EO.WebBrowser and Google Chrome are based on the same browser engine, they can be of different versions. So you may run into compatibility issues if you use Google Chrome browser as remote debug client. Using TabbedBrowser sample application as remote debug client can avoid this problem.
You should see a list of pages currently loaded. Here it only lists "Google" because that's the only page loaded;
-
Click the page you wish to debug to load the debugging UI. The following image shows the remote debugging UI after clicking "Google" in the previous screen:
You can now use the debug UI to debug your page the same way as in Google Chrome browser.